C# TeeChart 图表学习使用记录
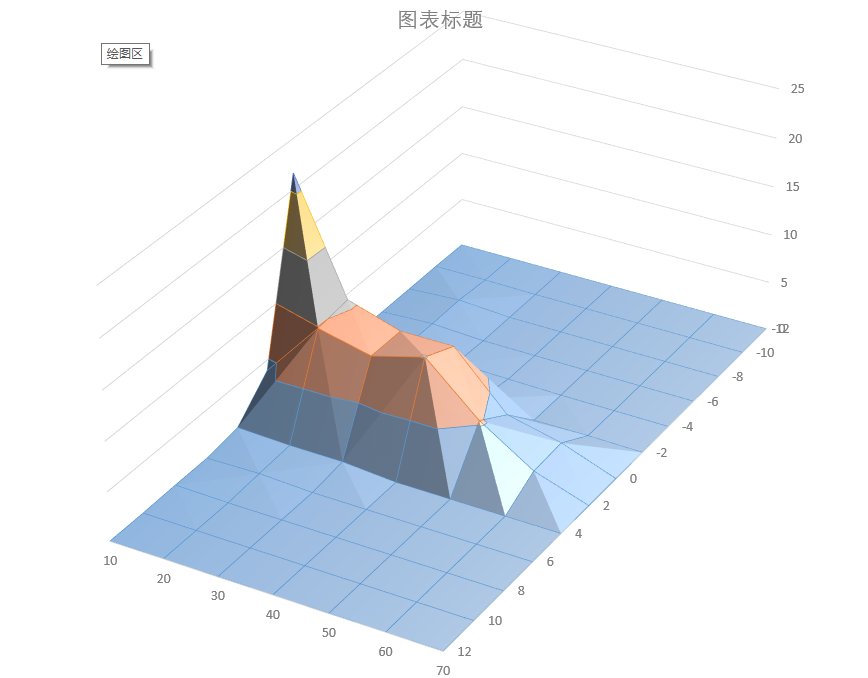
最近对工作有点新想法,想从公司车联网数据库中提取各种行驶数据进行分析然后生成报表(巴拉巴拉,索罗无关的东西就说了)。不如下面这种曲面图,看着样子可是Visual Studio自带的Chart控件可以满足的。

当然这个图现在是用Excel生成的曲线图。excel中是通过一个交叉表生成图表,数据如下:
| 10 | 20 | 30 | 40 | 50 | 60 | 70 | |
| -12 | 0 | 0 | 0 | 0 | 0 | 0 | 0 |
| -10 | 0.036169 | 0.050637 | 0 | 0 | 0 | 0 | 0 |
| -8 | 0.014468 | 0.332755 | 0 | 0 | 0 | 0 | 0 |
| -6 | 0 | 0.260417 | 0 | 0 | 0 | 0 | 0 |
| -4 | 0 | 0.332755 | 0.173611 | 0.079572 | 0 | 0 | 0 |
| -2 | 0.108507 | 0.217014 | 0.15191 | 0.643808 | 0 | 0.05787 | 0.000419 |
| 0 | 21.62905 | 10.28646 | 8.615451 | 8.65162 | 3.240741 | 2.003762 | 0.014495 |
| 2 | 3.899016 | 9.866898 | 8.637153 | 10.12731 | 5.309606 | 1.844618 | 0.013344 |
| 4 | 0.614873 | 0.426794 | 0.41956 | 0.007234 | 0 | 0 | 0 |
| 6 | 0.122975 | 0.238715 | 0 | 0 | 0 | 0 | 0 |
| 8 | 0.094039 | 0 | 0 | 0 | 0 | 0 | 0 |
| 10 | 0.007234 | 0 | 0 | 0 | 0 | 0 | 0 |
| 12 | 0 | 0 | 0 | 0 | 0 | 0 | 0 |
=======================分割线===========================
周末经过各种百度一番,搜索到TeeChart这个第三方控件。官方网站https://www.steema.com/

选择“.NET”版本的控件下载。下载的为评估板,非注册版本,2016版本好像暂无破解版本
首先先要将上述的交叉表转换成为二维表,如下:
| X | Y | Z |
| -12 | 10 | 0 |
| -12 | 20 | 0 |
| -12 | 30 | 0 |
| …… | ||
| 12 | 40 | 0 |
| 12 | 50 | 0 |
| 12 | 60 | 0 |
| 12 | 70 | 0 |
转换后的表格如下:![]() testData.xlsx
testData.xlsx
using System;
using System.Collections.Generic;
using System.ComponentModel;
using System.Data;
using System.Drawing;
using System.Linq;
using System.Text;
using System.Threading.Tasks;
using System.Windows.Forms;
using System.Data.OleDb;
namespace WindowsFormsApplication2
{
    public partial class Form1 : Form
    {
        public Form1()
        {
            InitializeComponent();
        }

        private void Form1_Load(object sender, EventArgs e)
        {

            Steema.TeeChart.Styles.Surface surface = new Steema.TeeChart.Styles.Surface();
            tChart1.Series.Add(surface);
            DataTable dt = ExcelToDataSet("d://testData.xlsx").Tables[0];
            List<double> arrayX = new List<double>();
            List<double> arrayY = new List<double>();
            List<double> arrayZ = new List<double>();
            for (int i=0;i<dt.Rows.Count-2;i++)
            {
                if (dt.Rows[i][0].ToString() == "")
                    break;
                arrayX.Add(Convert.ToDouble(dt.Rows[i][0].ToString()));
                arrayY.Add(Convert.ToDouble(dt.Rows[i][1].ToString()));
                arrayZ.Add(Convert.ToDouble(dt.Rows[i][2].ToString()));
            }

            this.tChart1.Axes.Depth.Visible = true;
            this.tChart1.Axes.Depth.Labels.ValueFormat = "0.#";
            this.tChart1.Axes.Depth.Increment = 10;
            this.tChart1.Axes.Bottom.Labels.ValueFormat = "0.#";
            this.tChart1.Axes.Bottom.Increment = 2;

            this.tChart1.Aspect.Chart3DPercent = 100;
            this.tChart1.Aspect.Orthogonal = false;
            this.tChart1.Aspect.Perspective = 50;
            this.tChart1.Aspect.Rotation = 327;
            this.tChart1.Aspect.Elevation = 352;
            this.tChart1.Aspect.Zoom = 70;
            this.tChart1.Aspect.View3D = true;

            surface.IrregularGrid = true;
            surface.Add(arrayX.ToArray(), arrayY.ToArray(), arrayZ.ToArray());
            //tChart1.AutoRepaint = true;
            //tChart1.Refresh();
            //surface1.FillSampleValues();
        }
        public DataSet ExcelToDataSet(string Path)
        {
            string strConn = "Provider=Microsoft.Ace.OleDb.12.0;" + "data source=" + Path + ";Extended Properties='Excel 12.0; HDR=Yes; IMEX=1'";
            OleDbConnection conn = new OleDbConnection(strConn);
            if (conn.State.ToString() == "Open")
            {
                conn.Close();
            }
            conn.Open();
            string s = conn.State.ToString();

            OleDbDataAdapter myCommand = null;
            DataSet ds = null;

            DataTable yTable = conn.GetOleDbSchemaTable(OleDbSchemaGuid.Tables, new Object[] { null, null, null, "TABLE" });
            string tableName = yTable.Rows[0]["Table_Name"].ToString();
            string strSel = "select * from [" + tableName + "]";//xls
                                                                //strExcel = "select * from [sheet1$]";
            myCommand = new OleDbDataAdapter(strSel, strConn);
            ds = new DataSet();
            myCommand.Fill(ds,"tables");
            DataTable dt = ds.Tables[0];
            conn.Close();
            return ds;
        }

    }
}
这是一种方法,使用Add方法将转换后的XYZ一条一条逐一写入数据;
值得要说的是,上述的表格是统计后的数据,所以生成后的图标应该是一个规则的图形。下面代码一定要执行,否者是不会显示出图形。
surface.IrregularGrid = true;//将不规则网格开启
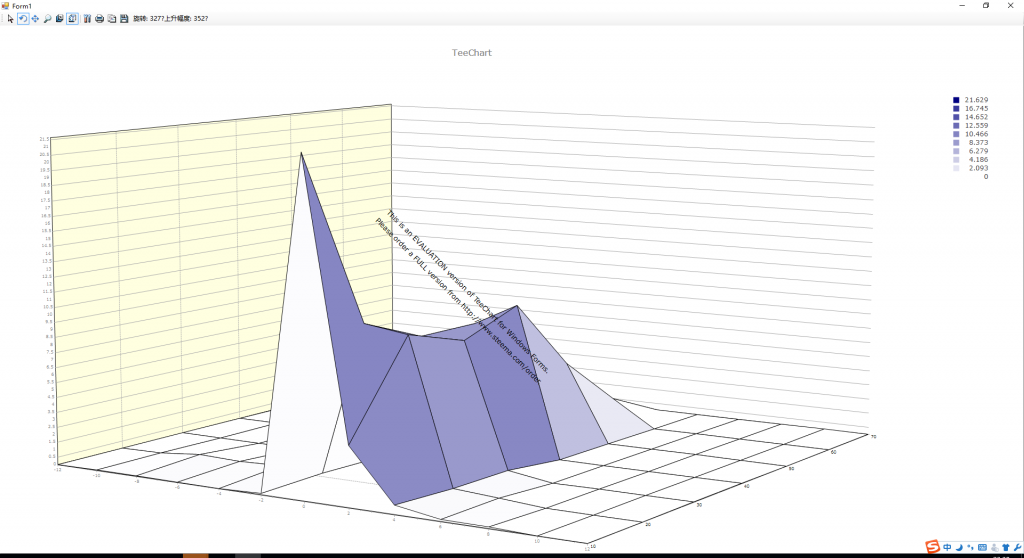
最后执行效果如下图:

上述的数据绑定属于一个比较原始的方法,下面的方法是直接通过设置DataSource绑定数据。
            surface1.DataSource = ExcelToDataSet("d:\\testData.xlsx");
            surface1.CheckDataSource();
有0条评论